COVID-19 – One Month Impact
I’m interested in tracking and reporting the impact of the pandemic response on market activity. The Ottawa Real Estate Board only provides monthly reports and tends to gloss over anything negative and spins things up.
Note: You might be interested in my first article on the impact of the COVID-19 pandemic on Ottawa real estate: COVID-19 Market Impact.
Any lasting impact on prices remains to be seen – price always lags behaviour, sometimes briefly and sometimes only after sustained change. Market impact from the pandemic and pandemic response is obviously “artificial”. Ottawa’s market may pick up right where it left off when things get back to normal, or there may be lasting effects of some magnitude – mild, moderate, strong – who knows.
I try to avoid predictions. But I insist on reporting the data that are current indicators – and those indicators beg for some interpretation. During this downtime, you’d expect prices to be impacted most by the difference in buyer and seller behaviour: as always, supply & demand forces drive pricing over time. Data right now shows that buyers are backing off slightly more than sellers.
Methodology
I’ve decided to track new listings and sales daily until things return to normal. It’s important to point out that my daily tracking does not employ the same methodology that the Ottawa Real Estate Board employs in producing their monthly statistics. This means my numbers are different than theirs, and that means when the April results come out from the Board they will be different than what my daily numbers suggest they might be.
Why is the methodology different? Firstly, they don’t share their methodology. One of the biggest differences is that they do not include all of the MLS area codes represented in our MLS system. Our MLS includes areas from Hawkesbury to Kingston, and even a few listings from other areas of Ontario outside of Eastern Ontario. I don’t know which areas the Board includes in their definition of “Ottawa” when they report our summary statistics. I have played around with removing some MLS area codes to create my own definition of “Ottawa” but in the end for the purposes of tracking COVID-19 pandemic impact, I’m just including everything.
Note that this means my new listings and sales numbers are all higher than what will be reported by the Board. This means that my calculation of any negative impact should be quite conservative. The real impact will be greater.
Sales
For context, here are the number of homes & condos sold in March and April each year since 2012:
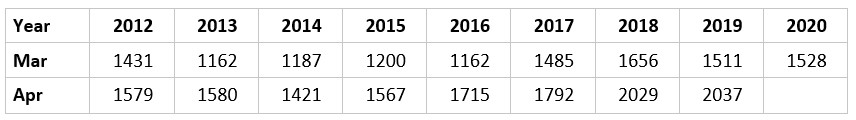
Referring to my statement about the difference in methodology – my daily tracking shows total sales in March 2020 of 1,783 whereas the Board reported 1,528 for “Ottawa”.
Dramatic Sales Impact
I’m writing this post on April 20th. There have been 487 firm sales in the first 19 days of April. That compares to 1,278 firm sales in the first 19 days of March using the same method of counting (my method for both).
That is a 61.9% decline in sales April 1 - 19 compared to March 1 - 19.
Take another look at the table above that shows March and April sales each year since 2012. April sales are always higher than March sales. It’s the beginning of the Spring market – sales increase monthly, peaking in either May or June (this varies from year to year).
I posted an update like this on Facebook on April 12th for the first 11 days of April. At that point the decline was 55%. I received some negative feedback from a couple of agents who argued that “sales have been declining for several years due to shrinking inventory” and “I’m cherry picking this one statistic and not putting it in context” and that “COVID-19 isn’t the cause”. Seriously? 55%? 61%? I think you’d agree that the COVID-19 pandemic IS the context. Beware of agents who feel their job is to spin every market scenario positively to encourage you to [ buy, sell, invest ] – whichever their spidey senses figure you’re most like to do. Facts are facts; data is data. We have a responsibility to report the data and help you make smart decisions in the context of that data.
Adjusting for the difference between my method and the Board’s method, based on 2,037 April sales per the Board’s data in 2019, the year over year decline in sales reported for April 2020 could be as high as 70%. I’m guessing it will be between 55% and 65%.
Prices
It is early to assess any impact on house prices in Ottawa, short or long term. The local economy is resilient, with a high percentage of home owners in jobs that they are able to continue during the pandemic, even if it means working from home. The largest work force segments are in the Federal Government and High Technology. If any City can bounce back, or hold the fort, it’s Ottawa.
However, a big enough economic downturn for the Country or a prolonged shutdown of the retail and other consumer sectors in Ottawa could snowball into a long enough period of slow sales that property values suffer at least for a little while. The underlying fundamentals of our real estate market, though, suggest that things will return to normal sooner rather than later. There have been way more buyers than sellers in our market for over two years now, as my monthly market graphs clearly document.
There isn’t enough data yet to accurately project any immediate impact on prices, whether it would prove to be for the short, medium or long term. I pulled some early data for the first 16 days of April and all of March:
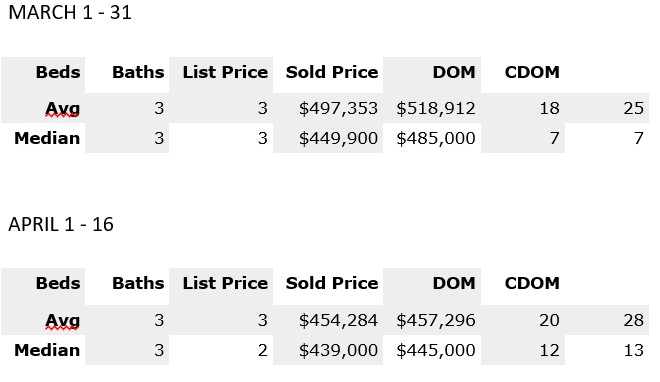
Sixteen days of sales data, plus including areas that lie outside of “Ottawa” make the above data unreliable. So please absorb it with caution. I just wanted to see if using the same criteria for March and April would show any sign of change or not. It does, but we’ll reserve judgement until the Board reports on April sales and prices in early May. I’ll take all of their raw statistics and graph them in early May and post them here on the blog as I always do. For more detailed analysis and commentary, check out my newsletter.
Advice
Agents who are working in their clients’ interest right now should be advising to list or buy only in urgent or emergency cases. Risk is not only inherent in the marketing and purchasing process, but in closing and moving as well. Most people can wait. Most people are staying home right now – how do you move when you’re staying home? I expect the leading indicators will drop further through April and probably May. Hoping for a phased-in return to normalcy beginning in June – but no guarantees.
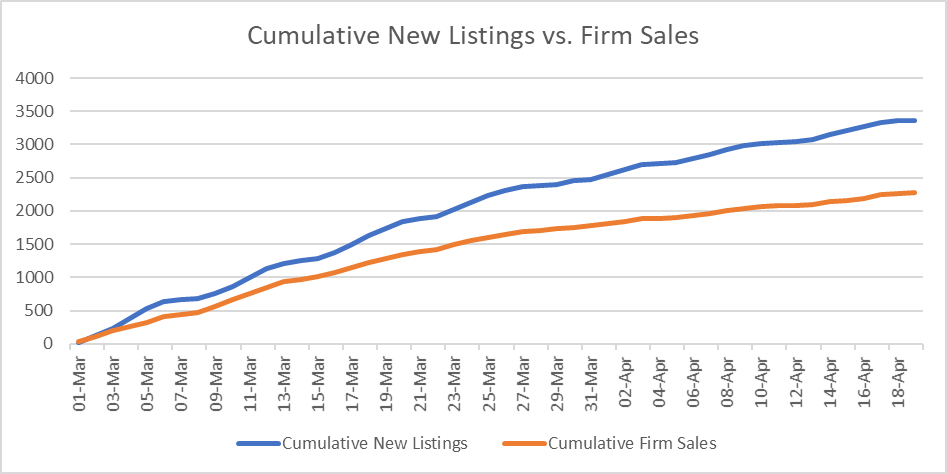
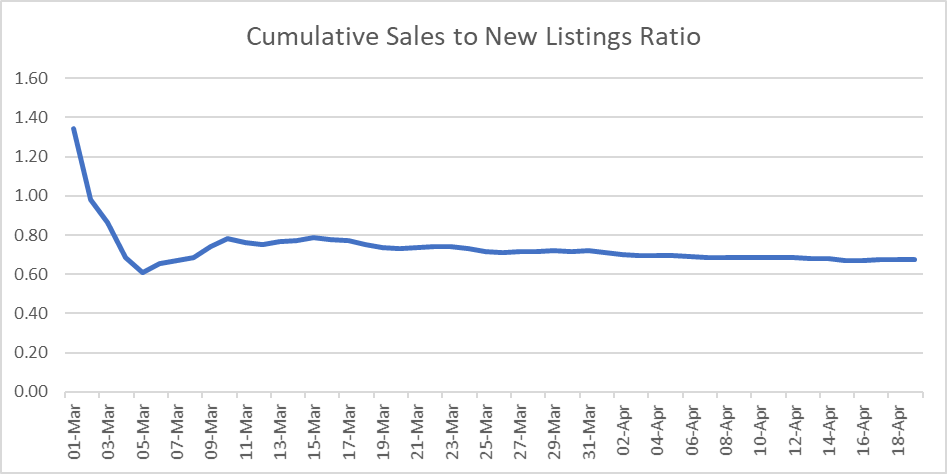
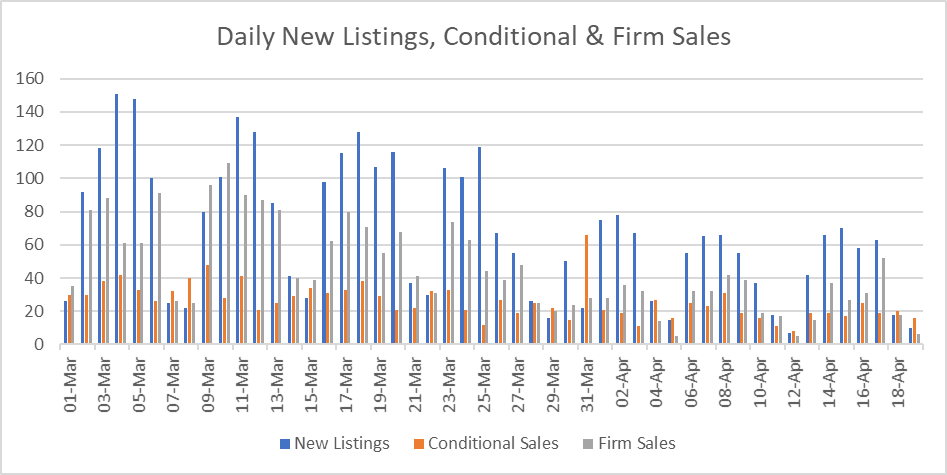
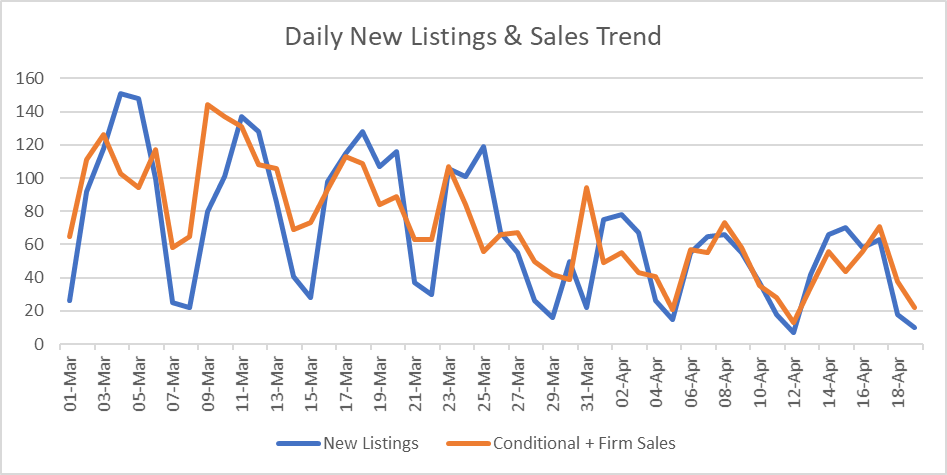
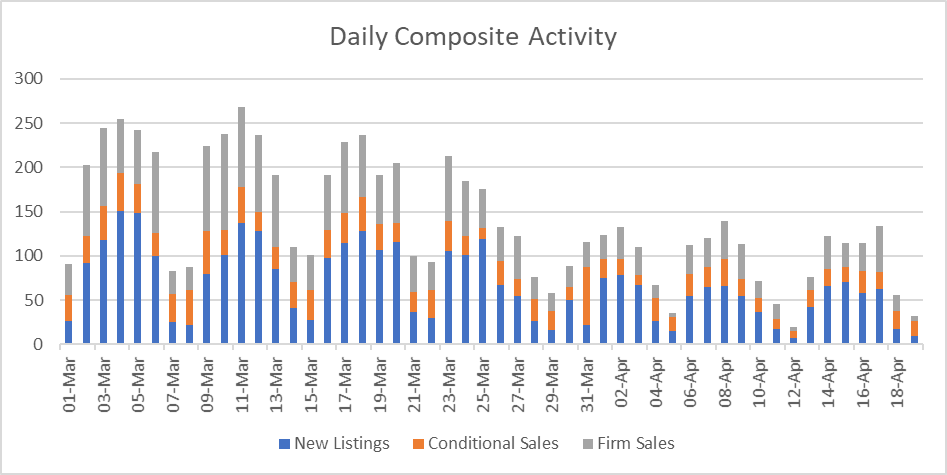
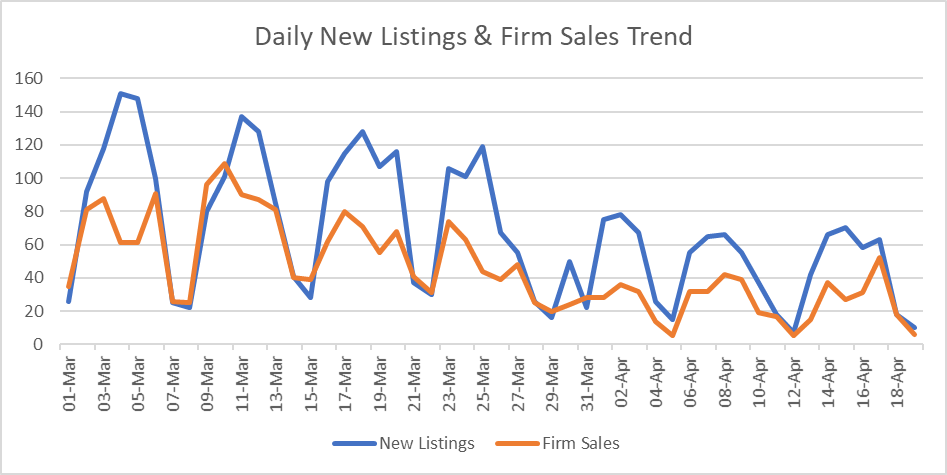
Graphs
Here are my daily tracking graphs, with data through April 19th.