OttawaAgent.ca
Ottawa House Prices by Neighbourhood – 2025
Ottawa House Prices by Neighbourhood
With 2025 in the books, you’ll find articles in every corner of the Internet reviewing the performance of the real estate market compared to the previous year. Did prices go up or down? Were there more or fewer home sales?
The Ottawa real estate board publishes its monthly statistical report and analysis, and in January it of course reviews the year as whole as well.
What I like to do early in the new year is look at the core statistics for each area within the City to see if there are any patterns – did homes in the suburbs increase in value more than homes downtown? Were there more sales in the West End than the East End? That sort of thing.
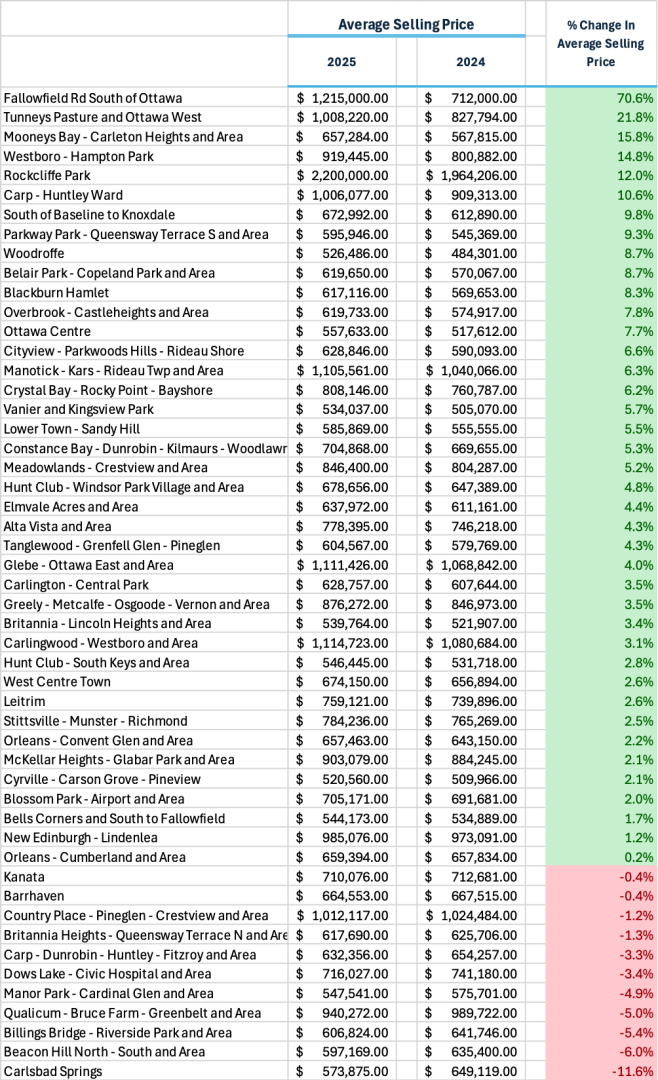
I’ve delved into the data and tabulated the average selling price of homes by neighbourhood – if you can consider MLS area boundaries to delineate “neighbourhoods” – alongside their respective average selling prices in 2024. I’ve then ordered the table from largest to smallest percentage increase in average selling price in 2025 compared to the previous year.
It’s important to note that some of the delineated MLS areas contain far fewer properties than others, and therefore the degree of reliability of the statistics in each area is not nearly equal. For this reason, one must take this data somewhat lightly – but it is still interesting, entertaining, and often indicative of trends, to be confirmed for your particular neighbourhood, street, condo building or property through specific research.
I hope you enjoy the data. I’ll note a few basic observations below the table.
Ottawa House Prices by Neighbourhood – Observations
- Average home prices in Kanata and Barrhaven are sailing level seas – during the pandemic, the suburbs climbed in value more than the downtown core, which was a reversal of a key historic trend. Since the end of the pandemic, things have been gradually reverting to normal. Over the long haul, there is always more upward price pressure on homes the closer you are to the City’s core and everything that makes Ottawa, Ottawa.
- Orleans prices have been rising more than Kanata and Barrhaven prices, despite a persistent myth claiming the opposite.
- You can always check the latest monthly statistics in summary tables that I curate and keep up-to-date on the Ottawa Housing Market page on this site. If you check it before I update it in early February with data from January, you’ll see that the average selling price of a single family home in Ottawa (including all types of property that are single family use) increased by 3.1% compared to the average price in 2024. The neighbourhood table above makes it crystal clear how average sale prices do not apply to individual properties – they don’t even apply to large neighbourhoods. The variation in price appreciation across the City is remarkable, with 23 areas appreciating less than or equal to the overall 3.1% average and 28 increasing more than 3.1%.
- The bottom 23 neighbourhoods appreciated between -11.6% and +3.1% – a range of 14.7%, while the top 28 neighbourhoods appreciated between 3.4% and 70.6%. 70.6% is clearly an outlier, undoubtedly due to low turnover in an area of low population and housing density. The next highest appreciation value was 21.8% – a considerable difference.
- Among marquis neighbourhoods that compete for “most desirable” on an annual basis, this year Westboro and nearby Tunney’s Pasture outpaced The Glebe considerably, with Manotick falling somewhere between them.
- In 2024, there were 5 neighbourhoods where the average home price exceeded $1,000,000. In 2025 there were 8.