
OttawaAgent.ca

Ottawa 2025 Rental Market Review
CMHC’s 2025 Canada-wide rental market report crossed my screen last week, and I realised it has been quite a while since I’ve provided an update on Ottawa’s rental market. It has definitely changed over the past couple of years, and one of the big questions I asked myself many times during 2025 as I drove back and forth across the City and into every neighbourhood is: there are so many new rental buildings under construction – what is their vacancy rate? Are they all filling up? How much impact is this burgeoning supply having on smaller investors and their ability to secure tenants? Have rental prices started to level off or come down after the past 5 years of increase?
Per CMHC, the average vacancy rate for purpose-built rental apartments in 2025 was 3.1% and for condominium apartments on the rental market was 1.3%. The average monthly rental prices for these two categories respectively were $1,550 and $2,305.
Their report confirms that the rental market softened in 2025. The above vacancy rates both represent increases compared to 2024. Vacancy rates for more affordable units remained much lower, while higher-end rentals experienced much greater vacancy.
CMHC tracked rental price for new leases and found that average rents decreased in 2025.
Here in Ottawa, the average vacancy rate for purpose-built rentals was 3.0% and for condominium apartments was 0.6%. Average rents were $1,926 and $2,503 respectively. It seems our purpose-built rental stock is disproportionately expensive.
Perhaps the most interesting finding in the report is the difference in vacancy rate between older and newer units. The chart below is copied from the CMHC 2025 Rental Market report.
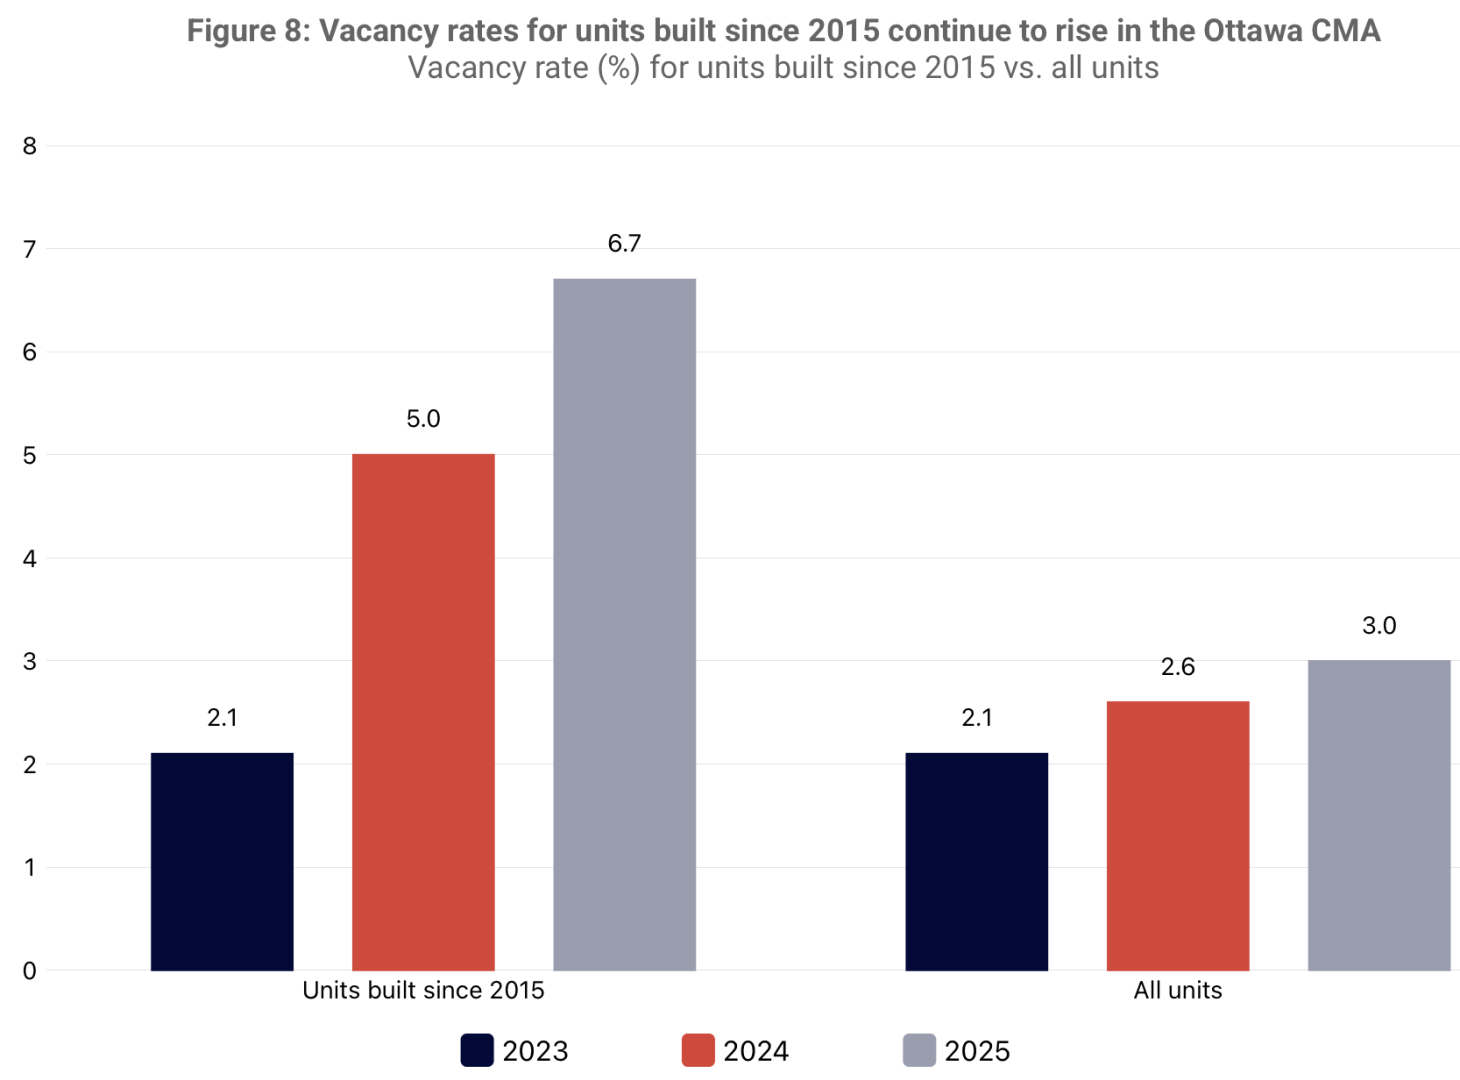
This graph combined with the overall vacancy rate for condominium apartments appears to answer my biggest question – are all those newly constructed units filling up? It seems, not entirely.
I thought it would be interesting to dig up some raw 2025 rental data for Ottawa to characterize the market more granularly. I’ve pulled and compiled the following data from the Ottawa Real Estate Board’s MLS system.
The first table charts rental unit activity by month throughout 2025.

Interesting data. Here are a few of my observations:
- The transaction volume curve is much flatter than the volume curve for MLS sales transactions. Monthly sales ranged from 562 in December to 1,569 in May, or in other words, the busiest month saw three times as many home sales as the slowest month. For rentals, volume ranged from 377 in February to 633 in July – the busiest month not even doubling the slowest month.
- Home sale peak in May, but rentals peaked in July.
- Despite fairly consistent demand (lease transactions completed) throughout the year, the number of properties offered for lease has been rising.
- The lease transactions to new listings ratio and the months of inventory on the market show that it was easier for landlords to acquire new tenants in the first half of the year than the second half. Is this a seasonal phenomenon or a trend toward more vacancy and an even more difficult rental market for investors? The first half of 2026 should provide strong evidence to help answer that question.
The second table shows the breakdown of rental transactions by property type. This provides detailed insight into the rental market that does not include the massive number of new purpose-built rental apartment towers recently and currently being constructed. CMHC’s vacancy and average rental rate data shared at the top of this article compares only purpose-built rental apartment buildings with condominium units.
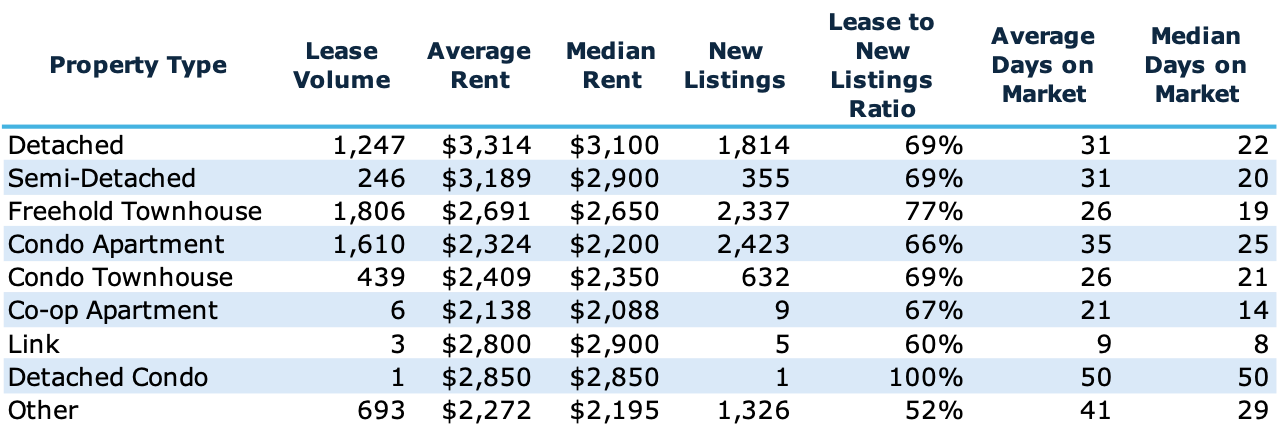
Some of my observations:
- We have a mysterious “other” category. I’m not sure why there is an “other” property type in the MLS database. I’ve never noticed it before, and certainly never used it when I’m entering data for one of my client’s properties to market it for rent or for sale. I’m hoping this may be related to the MLS technology migration the Ottawa Board implemented last year. Some fields in existing or historic listings was not perfectly mapped, and is being retrofitted over time.
- Detached homes make up a larger percentage of the MLS rental pool than I would have guessed. By my analysis, a detached home represents the least attractive investment property type for an investor. More on this topic in coming articles.