Hottest and Coldest Ottawa Neighbourhoods 2015
With 2015 in the books, it’s time to have a look at which neighbourhoods saw the most home and condo sales activity.
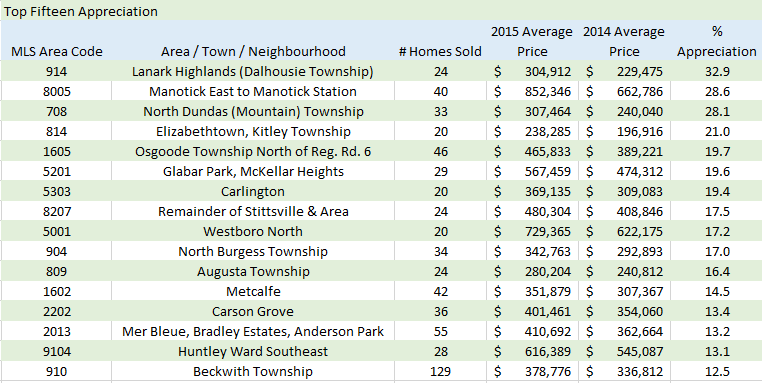
This article looks at where average sale prices rose the most – or fell the most – compared with 2014. Every month the Ottawa real estate board issues a news release with average sale price information and they rightfully state that you have to be careful with “averages” because they do not indicate what the value of any individual property may be, or even whether a property may be increasing or decreasing in value.
One of the top 3 questions people ask me if they haven’t seen me for…. heck even a week it seems sometimes… is “How’s the market?” Well, real estate markets are hyper local, and the tables I’m sharing in this article will make that abundantly clear. While the average home price in Ottawa increased 1.6% in 2015 compared to 2014, this means absolutely nothing for your house or condominium. Depending on what neighbourhood you live in, average prices may have gone up by as much as 32.9% or down by 27.9% – a ridiculously wide spread!
But don’t get overjoyed or totally depressed about the value of your house based on these neighbourhood averages either, because within any given neighbourhood some properties may have appreciated by a lot while others have gone down in value.
Hottest and Coldest Ottawa Neighbourhoods 2015
This neighbourhood information, taken on the whole, is useful if you’re looking to identify opportunities to invest or divest, to buy or sell, but are only the very slimmest starting point in your research. You have to delve into street by street and project by project sales, and look at other developments in the area – businesses coming and going, amenities, infrastructure, and many other factors. You can really get a sense of this from the tables below when you see things like Little Italy (West Centretown) behaving very differently West of Preston vs. East of Preston. Several new condo buildings completed many units West of Preston over 2015, and in coming years the reverse may be true.
For now, enjoy the data!