Suburban Breakdown
If you’re thinking about buying a home in Ottawa’s suburbs, you might have tried to figure out which one is the smartest choice.
Obviously there are things that are important to you other than how the market is doing – like where your friends and extended family live, where you’ve lived in the past, and where you work & play. But it would be a little unusual if the market didn’t cross your mind at least briefly. So which suburb has the hottest market? Is one of them a better buyer’s market?
Maybe you saw this article in the Ottawa Citizen a few weeks ago: Housing’s New Hot Spots. If you already own a home in the suburbs, I’m sure you found it interesting. When I saw that article, I did a quick analysis of 2016 MLS data to verify the trend for myself. I wrote about it in this article: Battle Of The Suburbs.
To me the data shows that the idea everyone is leaving Orleans and moving to the Barrhaven or Kanata is simply false. But I wanted to take a closer look.
Maybe the most interesting thing about real estate is how important location is. You know the old expression that real estate is all about “location, location, location” – but you might not realise just how strongly this proves to be true when you look at the data in detail. I broke down the sales and prices of homes in the suburban neighbourhoods of Ottawa by individual neighbourhood, and below are two tables ranking every individual area first by change in number of homes sold and then by change in average selling price.
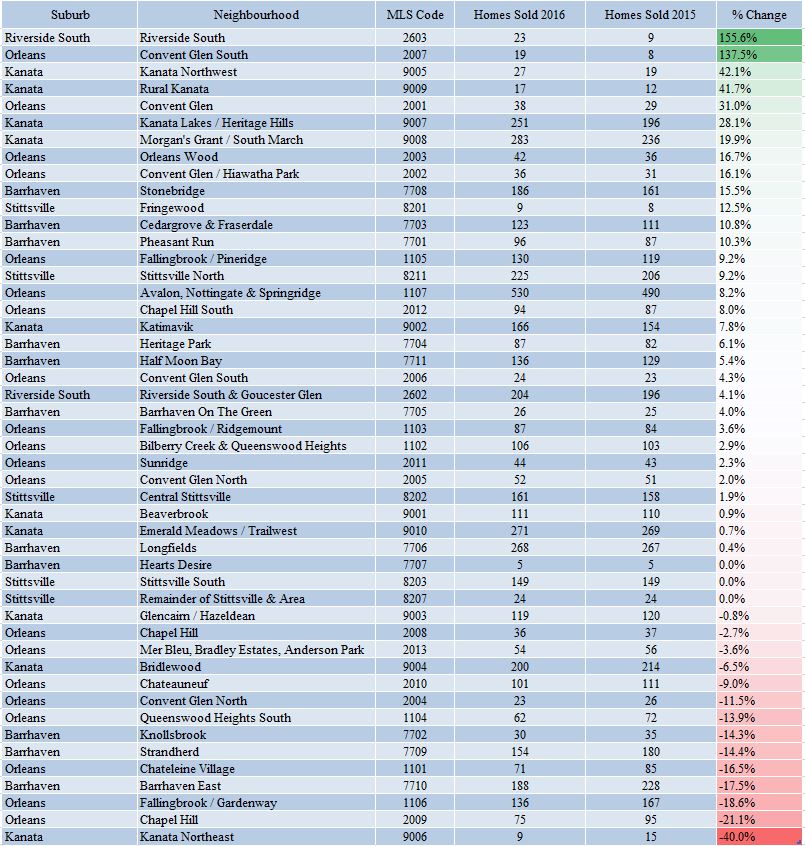
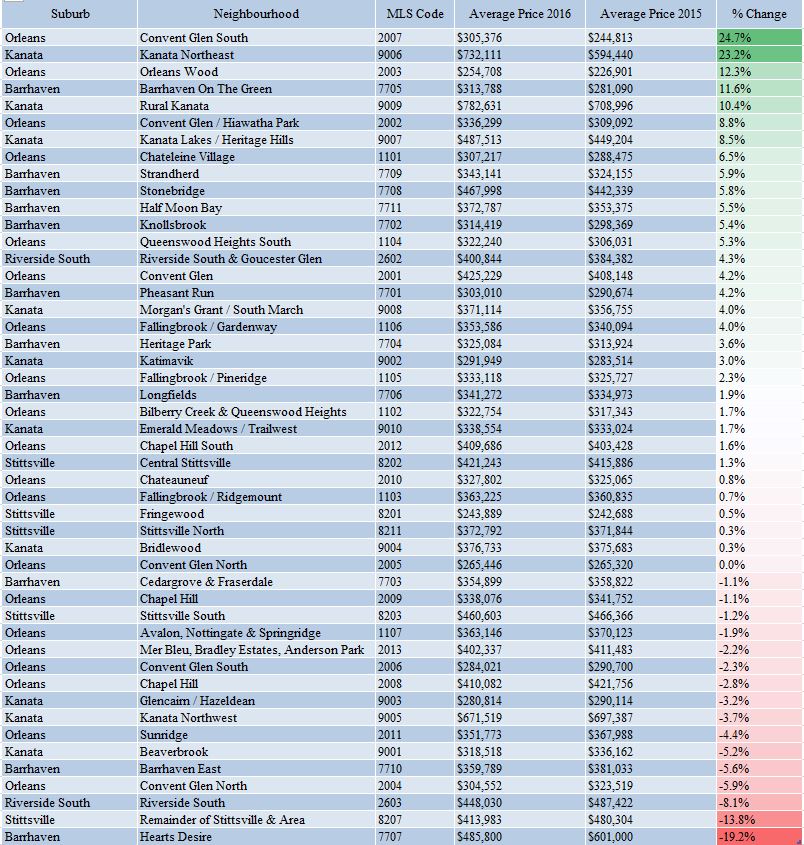
The first table essentially ranks “growth” – which areas saw the biggest increase in number of homes sold in 2016 compared to 2015. The second table ranks “value” – which areas had the biggest increase in average sale price in 2016 compared to 2015. Have a look at the tables and I’ll make a few closing remarks below.
Ottawa Suburban Neighbourhood Home Sales 2016 vs. 2015
Ottawa Suburban Neighbourhood Home Prices 2016 vs. 2015
Looking back to the Ottawa Citizen article and my first article on this subject, you’ll see that home sales and prices averaged over large areas hide the details of specific locations. The average home price in Kanata went up 4.1% from 2015 to 2016, while in Orleans the average price only went up 0.9%.
But the tables above show that individual neighbourhoods within each of these suburbs had price changes anywhere from a 24.7% increase to a 19.2% decrease. One factor, of course, is the number of sales in each area. When you look at a specific neighbourhood, you’re only dealing with 10 or 15 homes in some cases – not a large enough sample size to be statistically meaningful. Here’s an exercise for you: choose your favourite neighbourhood. Look at the average sale price change – is it at one of the extremes (prices went up a lot or down a lot) or is it near the middle of the pack (the price change was closer to the average for the whole suburb where the neighbourhood is located)? You might expect to see that areas with the most home sales have price changes closer to the average for the overall suburb, because the sample size is larger.
At OttawaAgent.ca we think the “Best Ottawa Suburb” is the one that offers the best quality of life for you and your family, and based on the data, we don’t think the data should be a huge factor in your decision. But this data might help you choose your specific neighbourhood. If you’re investing, you definitely want to take a closer look.