Ottawa Neighbourhood House Prices 2018
This article contains the full set of charts to support my February 2018 email newsletter. If you’re interested in receiving complete monthly Ottawa real estate market analysis, why not sign up and try it out. You can always unsubscribe, and no one will hunt you down to find out why. You’ll find a subscription link at the bottom of this article, or you can head over to the sign-up page here: OREM Sign-Up
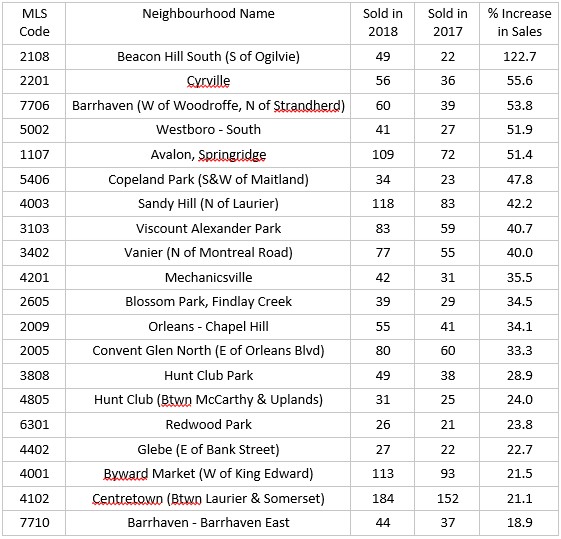
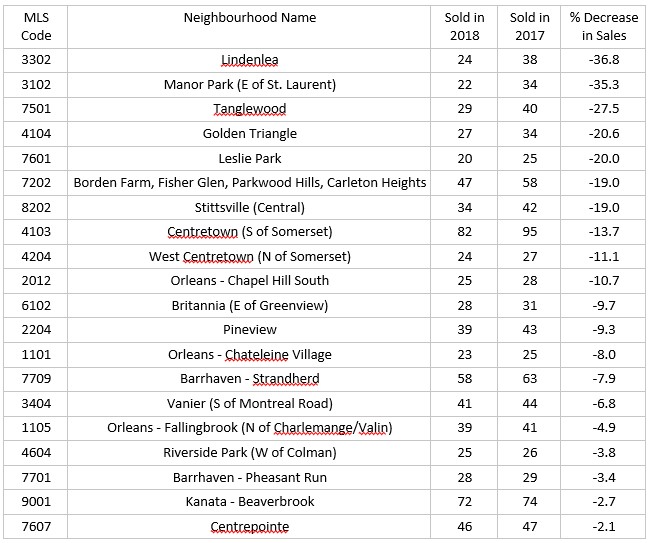
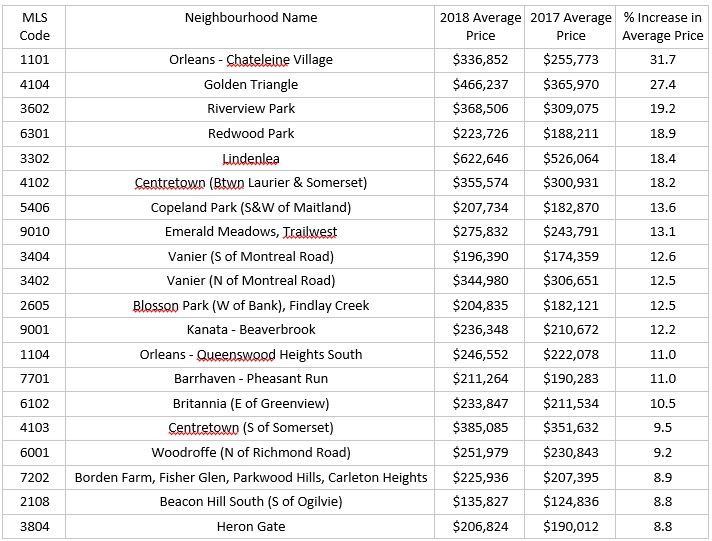
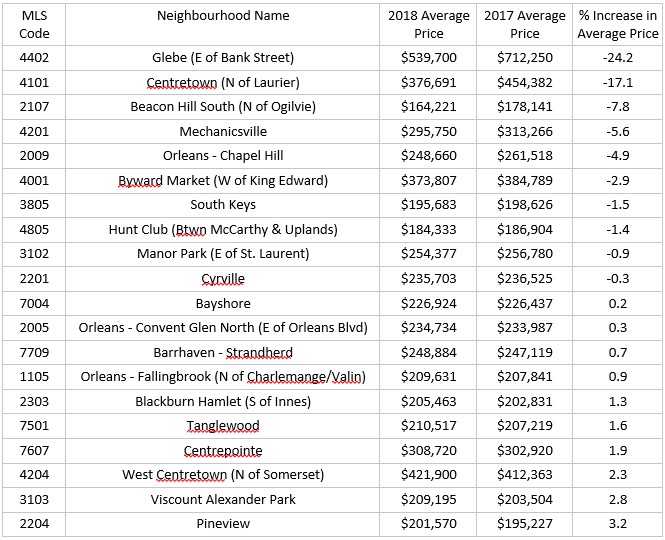
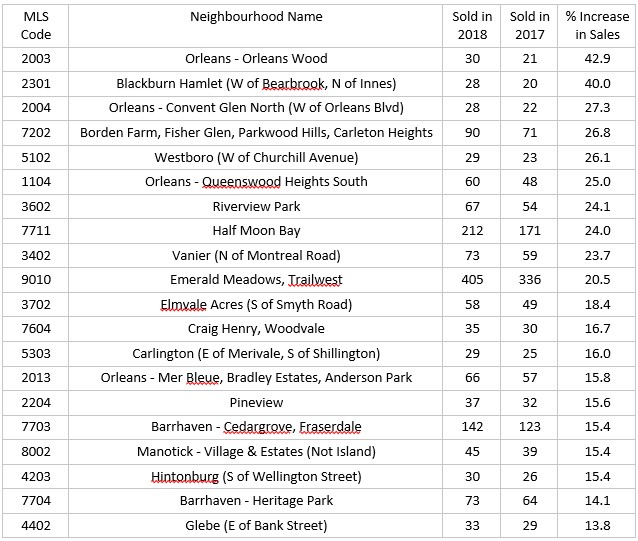
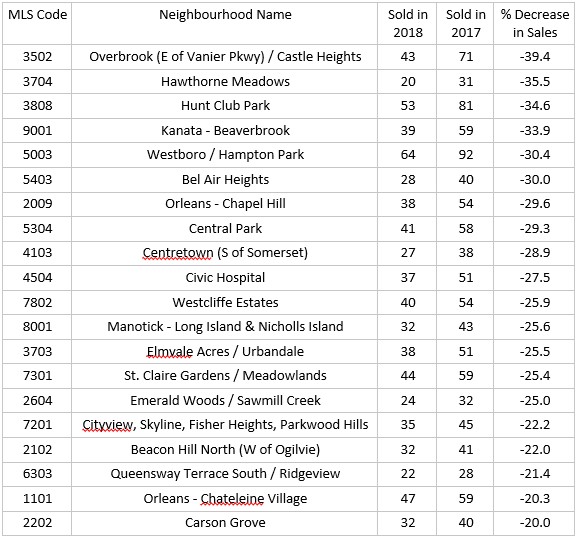
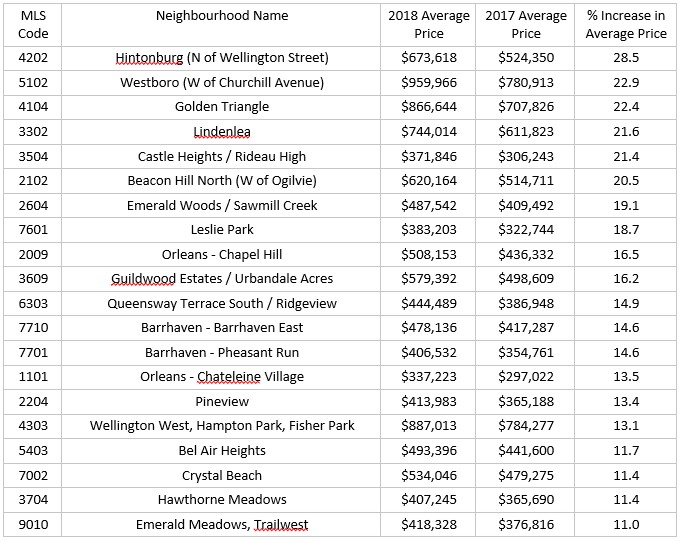
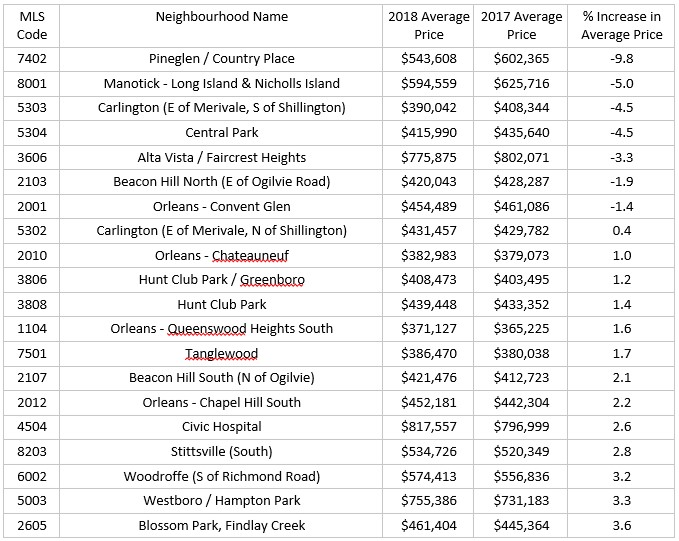
All of the tables here represent the top 20 or bottom 20 Ottawa neighbourhoods for change in the number of properties sold or average sale price in 2018 compared to 2017. The idea is to learn where sales and prices are rising most rapidly or least rapidly (or decreasing!) across the Nation’s Capital. Please note there are assumptions and caveats associated with this data; the methodology is outlined fully in the February 2019 edition of my newsletter. An online copy of that edition is here: OREM February 2019.
Also in the February newsletter I invent a quadrant metric based on my interpretation of the data in these tables. The metric may help guide decisions and approaches to buying or selling your home or investment property in the various market scenarios.