Ottawa House Prices 2014
A couple of months ago I decided to carve up the City of Ottawa into a few big chunks to help understand house prices and condo prices in different parts of town. Of course, where you draw the lines is somewhat subjective and could be debated all day long, but I think for the purpose of getting a general idea of how prices are doing in different areas, the line drawing doesn’t have to be perfect. Sure, some of you may have preferred that I drew the line on the other side of the street, but if you really want an accurate picture of house prices in your immediate area, then just drop me a line and I can put together the price history for your precise MLS area code (neighbourhood) or within any boundaries you care to define.
I’ll be writing another article soon to provide a complete list of which MLS area codes I’ve put into each of the major areas so that you can figure out where your house or condo is in these graphs. I’m going to stick with these definitions and update these graphs each year.
Ottawa House Prices 2014
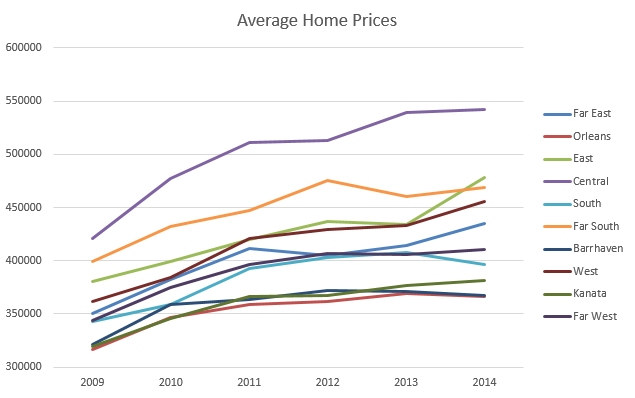
So here you have it, house prices and condo prices in each major area of the City over the past 5 years as posted a couple of months ago but now with 2014 sales in the history books. And in the graphs.